Plan the network on today's city, not last year's map

Mapflow turns recent satellite imagery into the three datasets RF planners work with: population grids, 3D maps of terrain, buildings and vegetation, and clutter packages ready for Atoll. Order a whole region, or update only what changed.

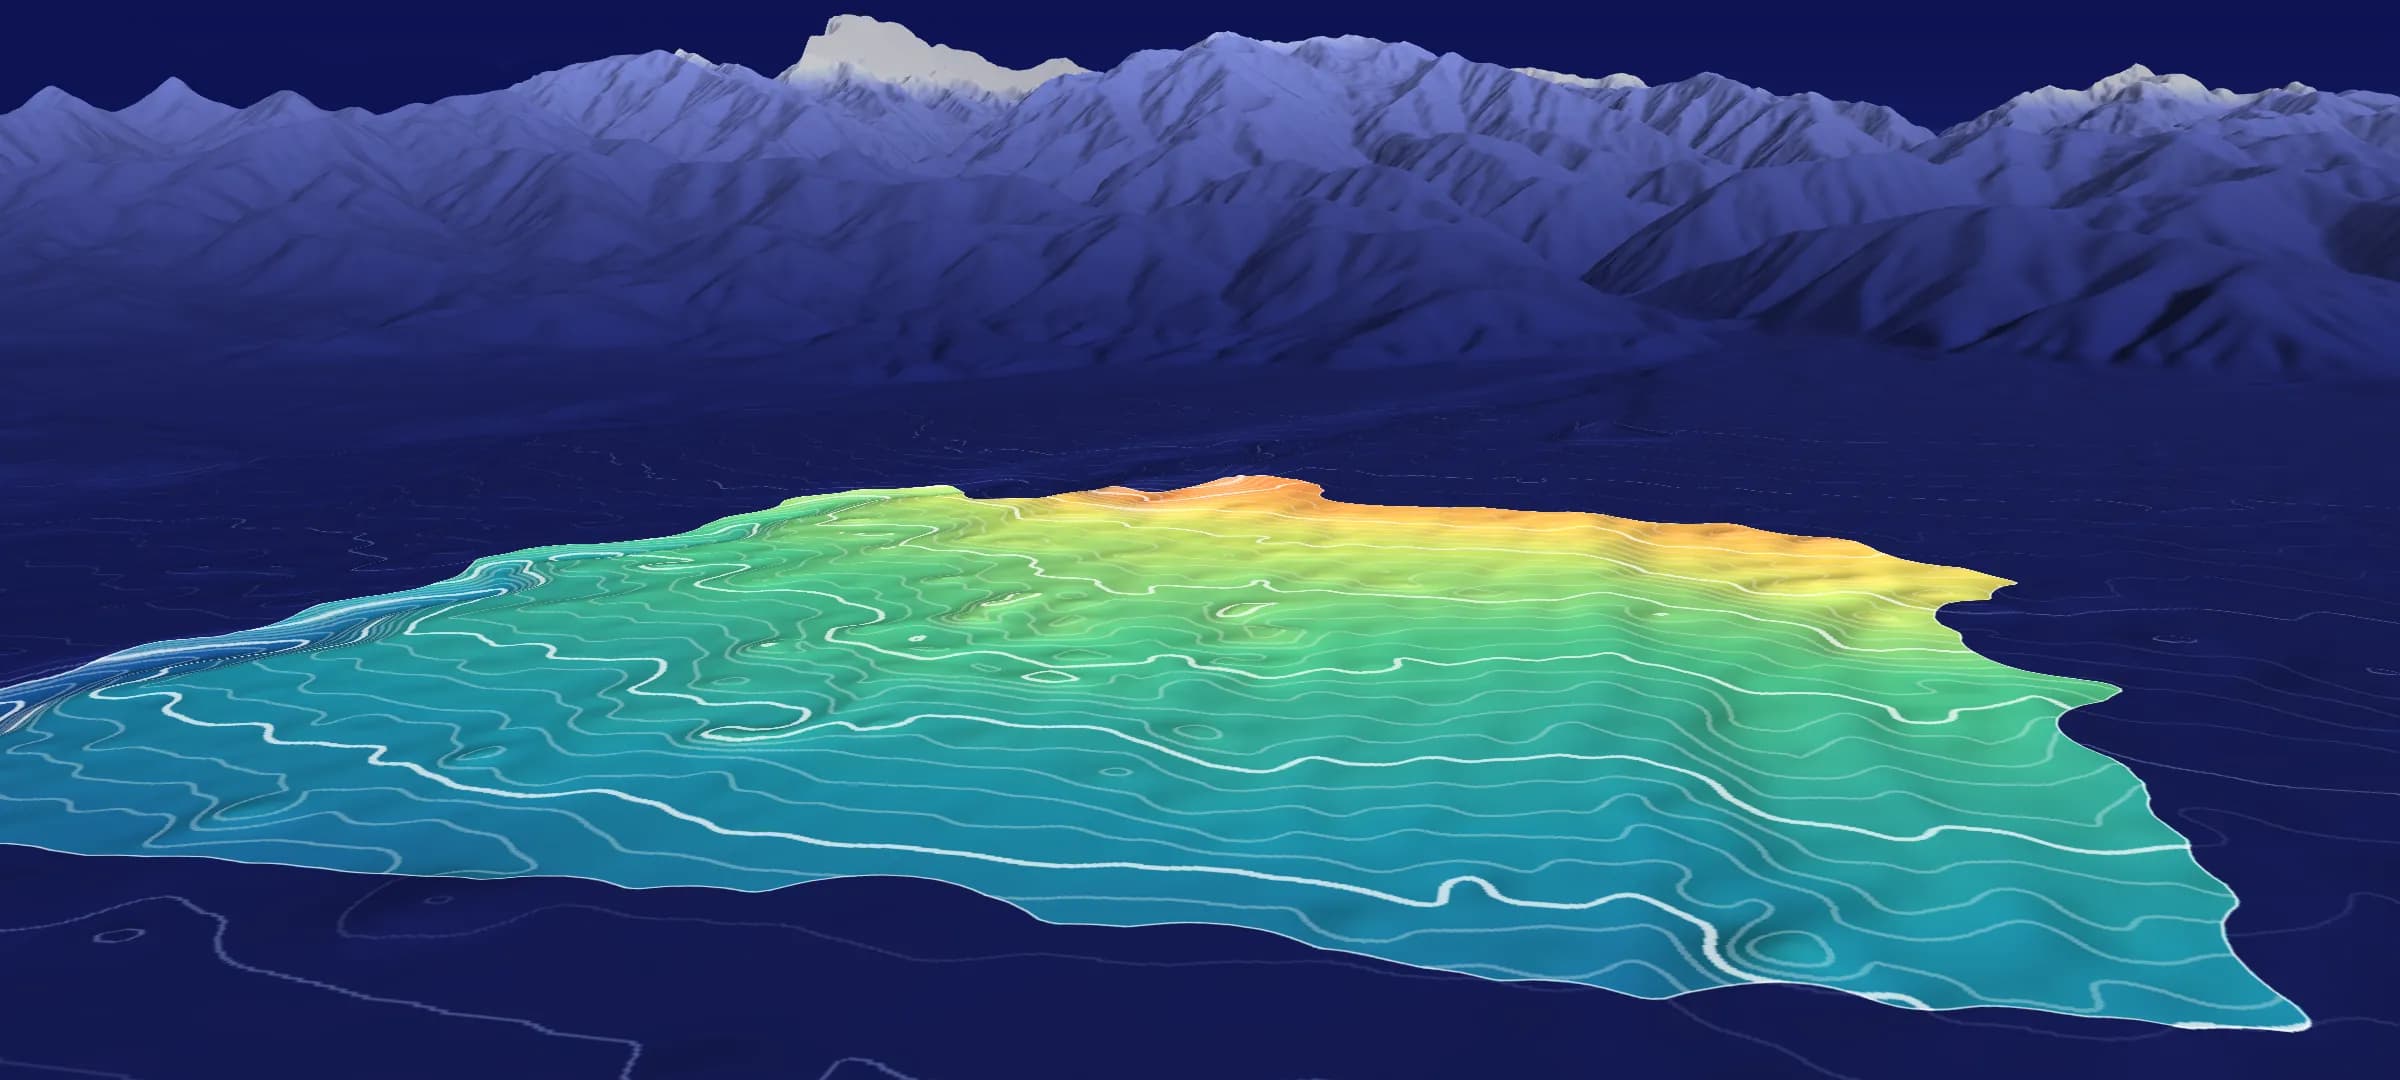
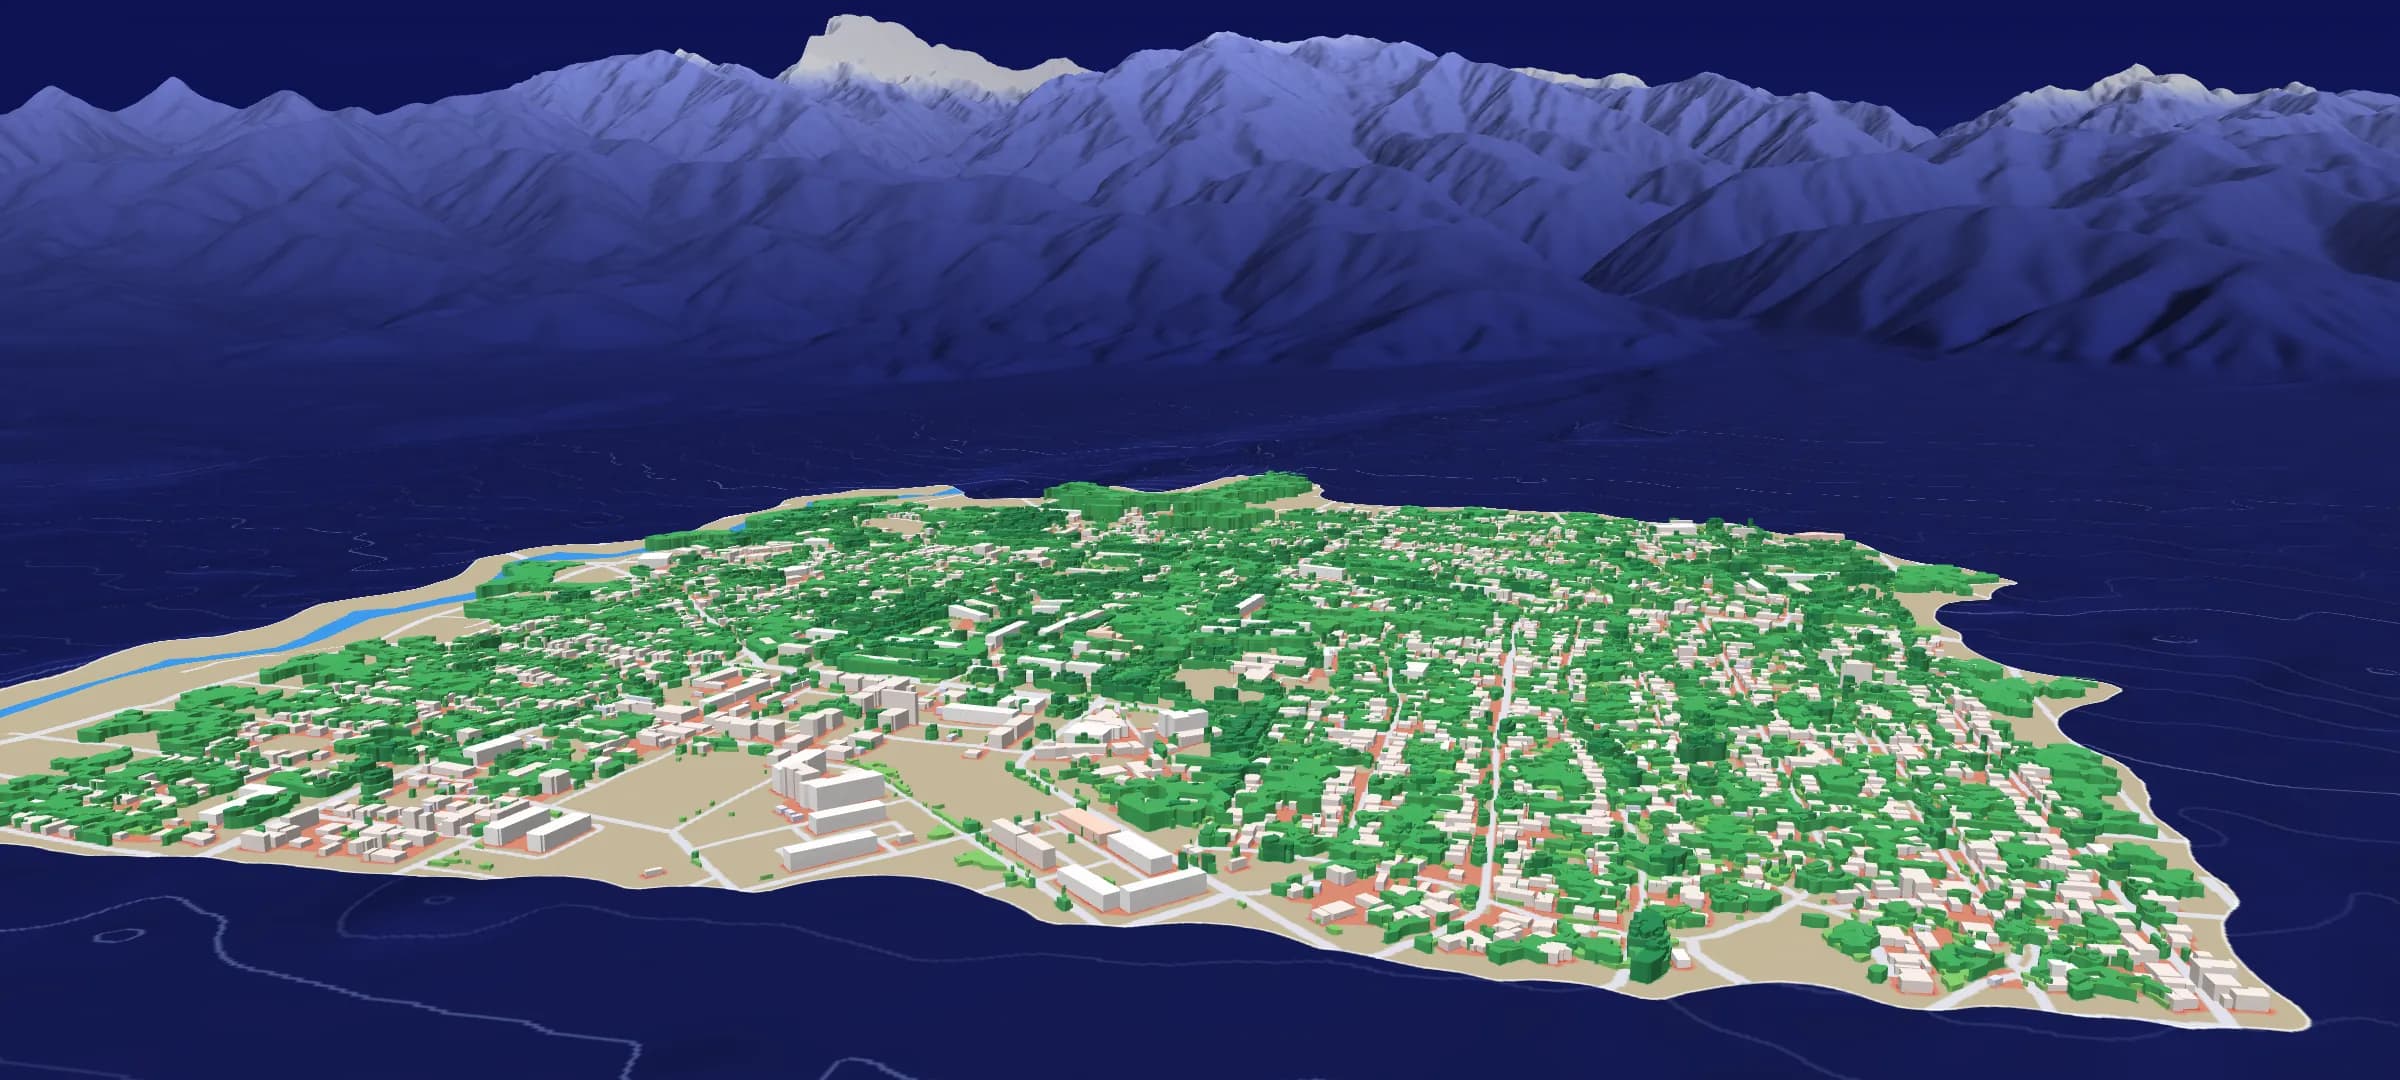
Talgar in 3D: the selected area colored by elevation with contour lines, the Trans-Ili Alatau behind it
Elevation946 m1,019 m

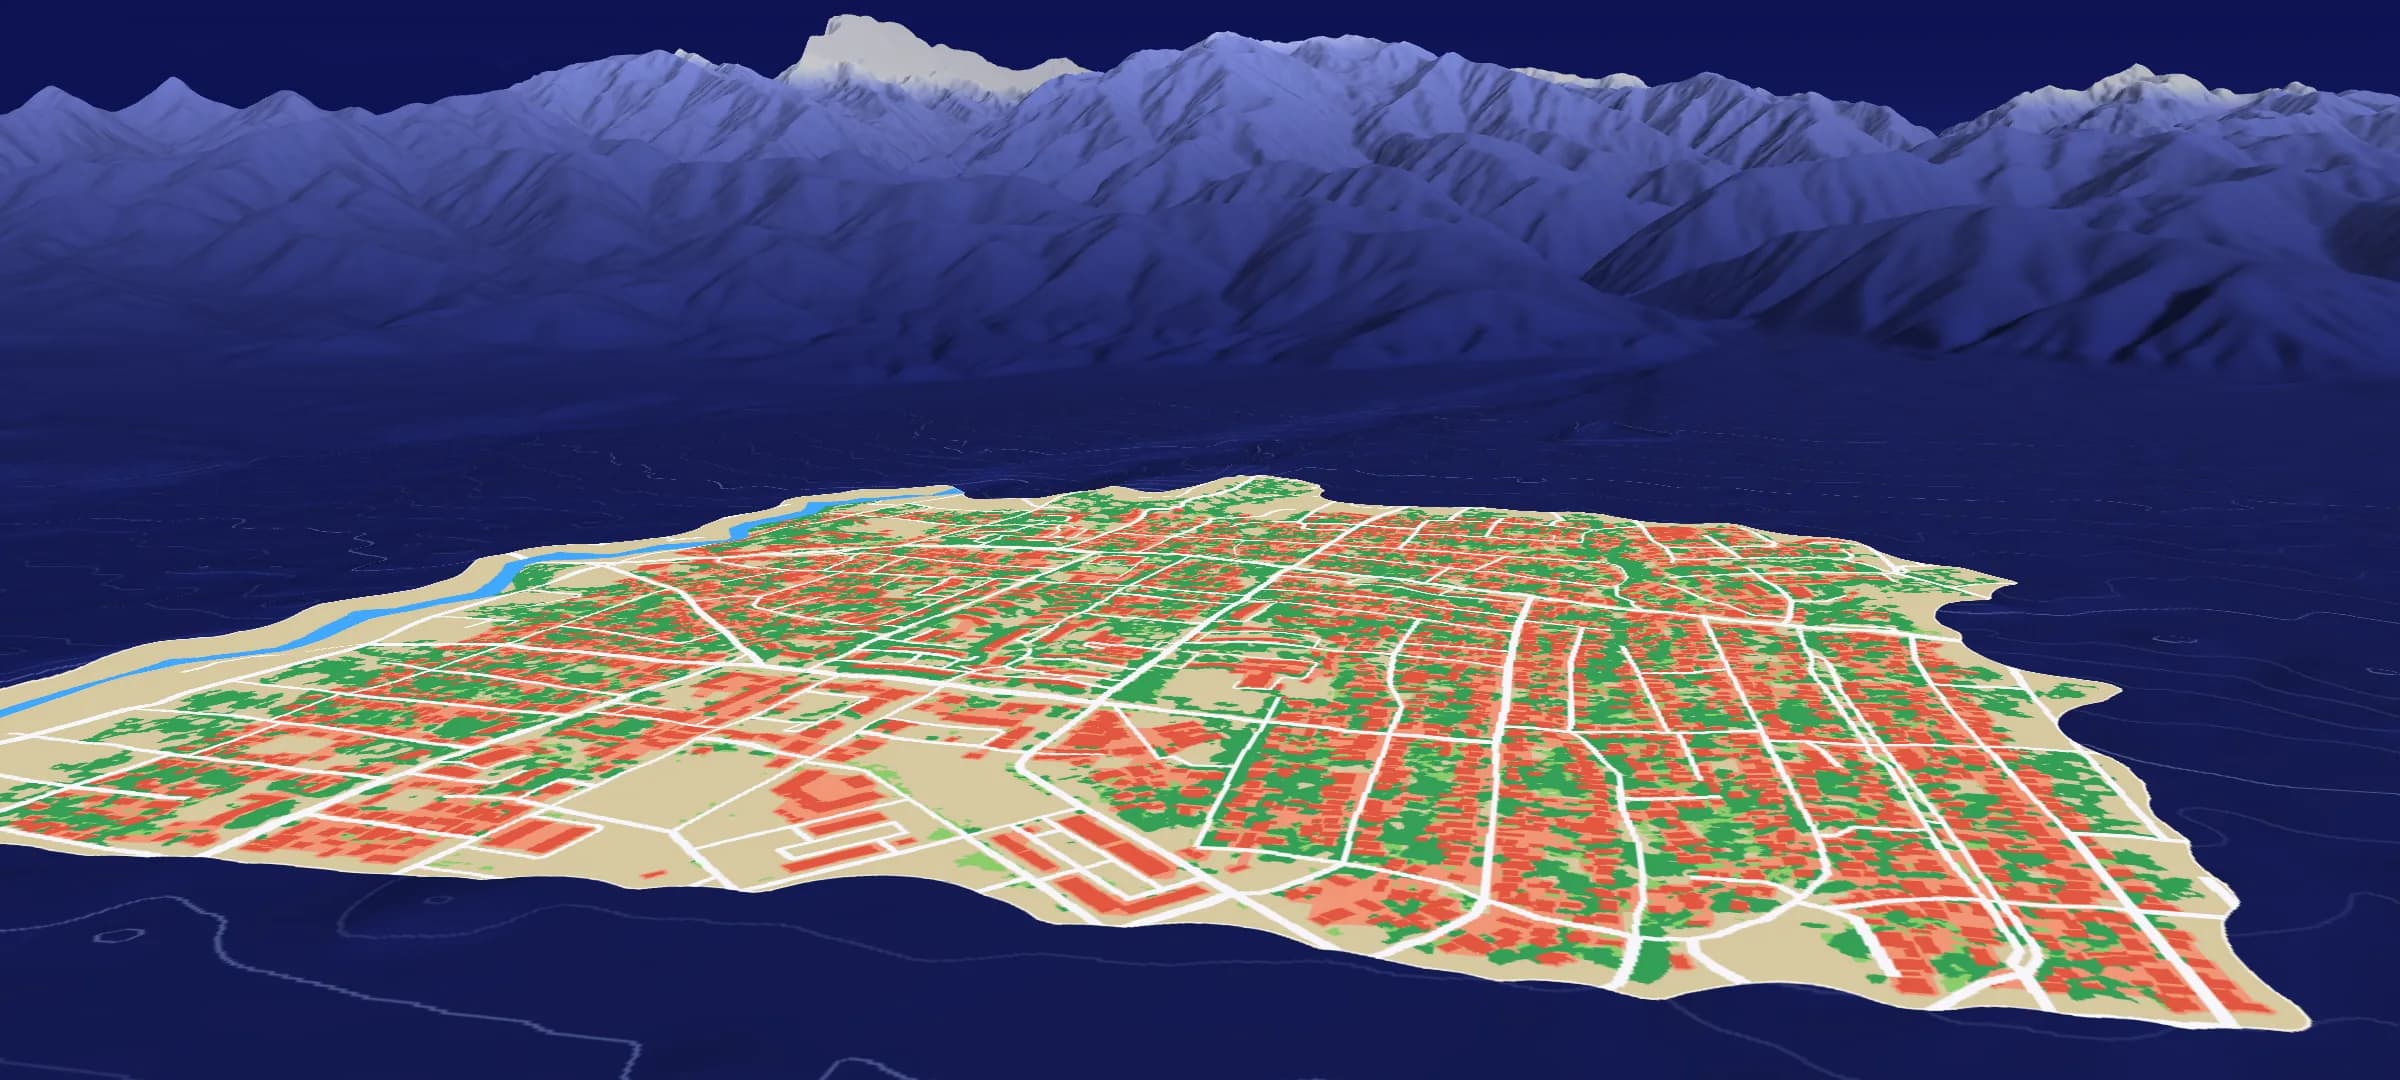
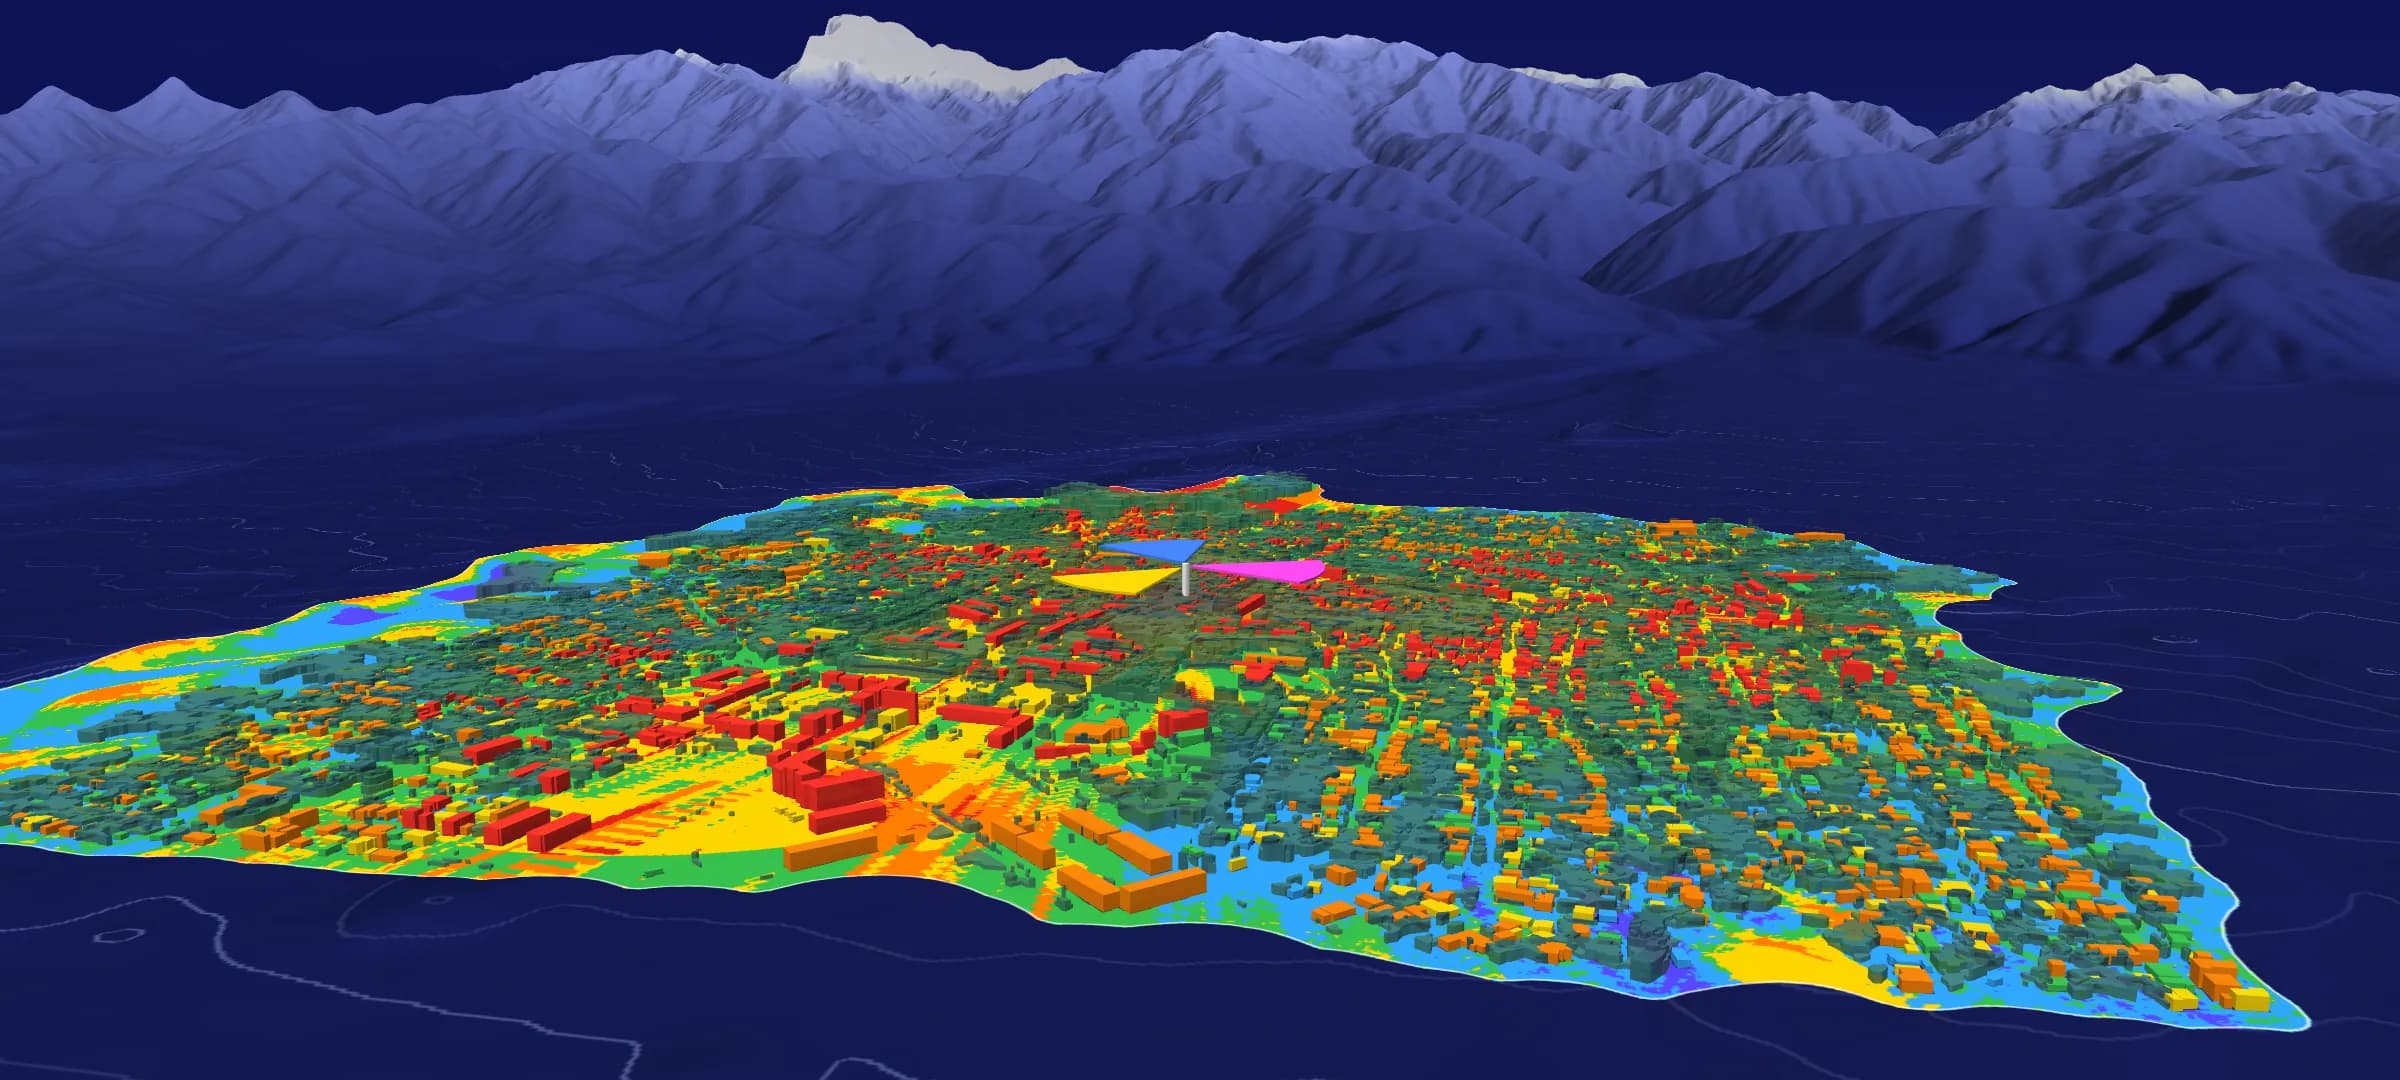
Talgar, Kazakhstan: 3,203 buildings and 14,240 trees and vegetation areas extracted by Mapflow. Terrain: Copernicus DEM GLO-30. Roads and river: © OpenStreetMap contributors. Coverage from a simplified propagation model, for illustration.

Population maps

Know how many people every cell serves

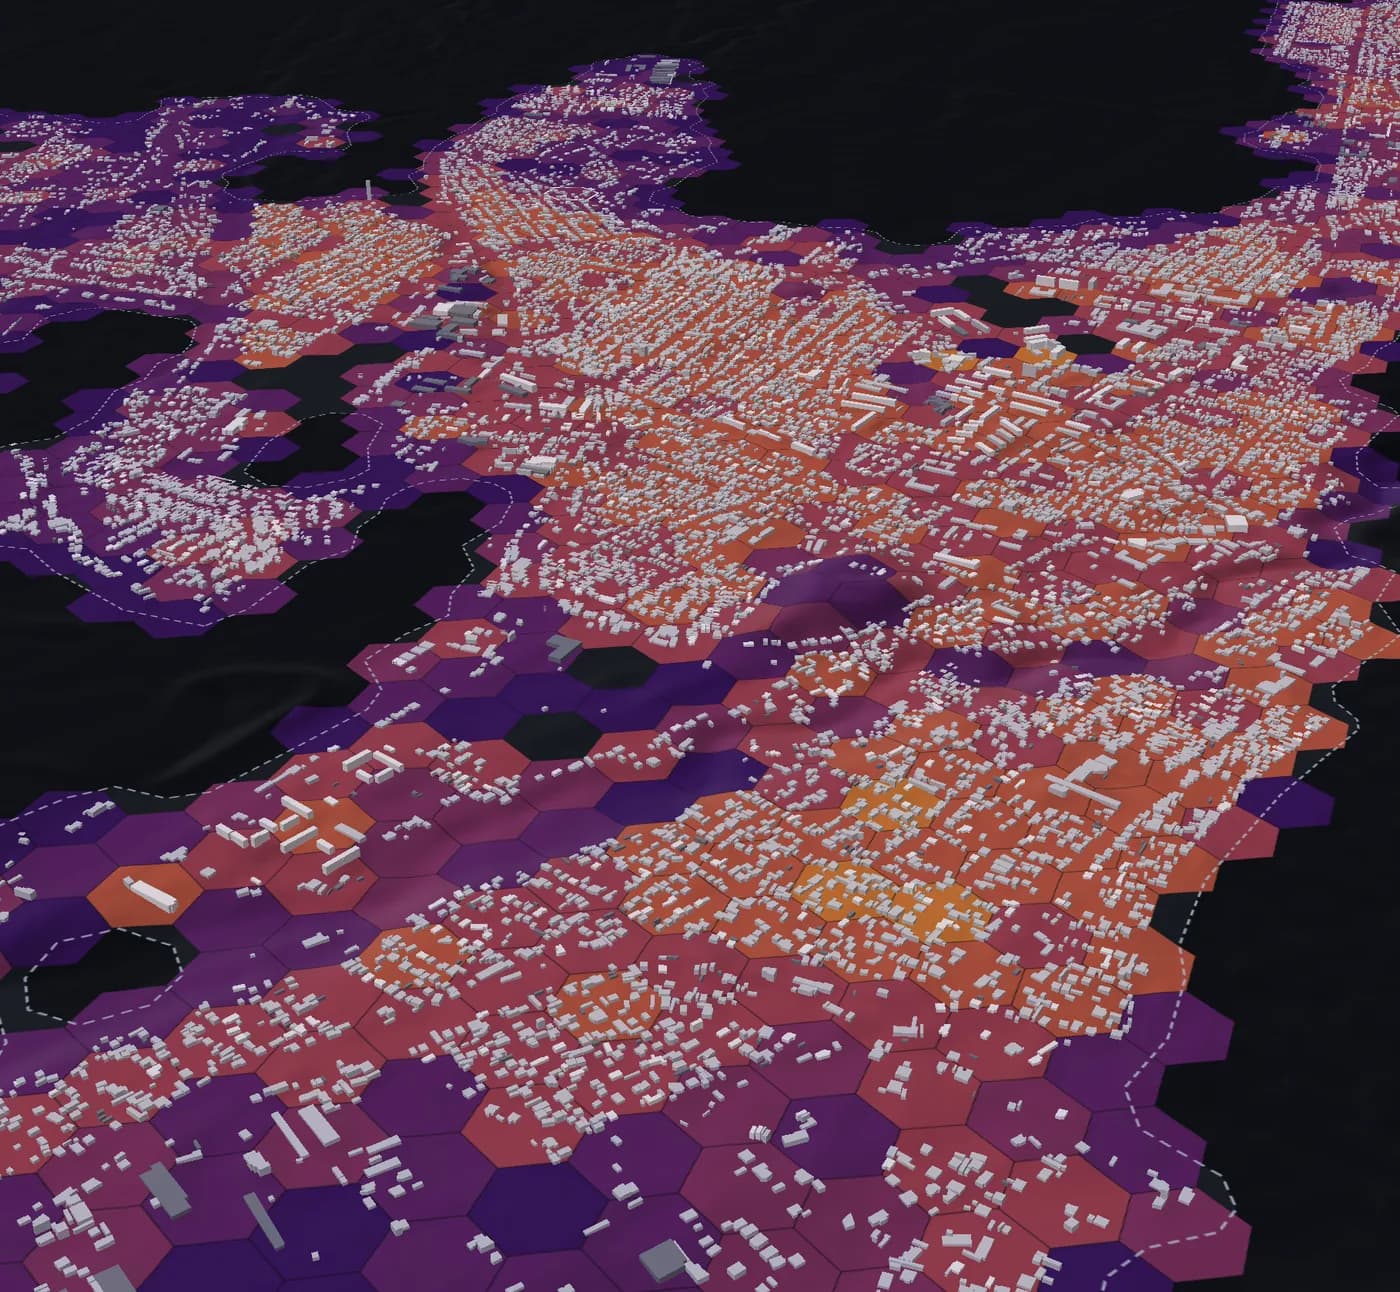
Census or official population is spread across residential buildings by volume (footprint × height), then rolled up to an H3 hex grid of about 1.5 ha cells. The grid joins straight onto coverage predictions, traffic and site data.

Open full screen (opens in a new tab)
3D view of Talgar: population on an H3 hex grid draped over terrain, with Mapflow buildings extruded to their heights

Talgar, Kazakhstan

37,751 residents across 19,683 Mapflow buildings, on Copernicus terrain. Switch allocation models, tilt to 3D and hover any cell.

Capacity planning

Estimate how many people each sector serves and add capacity before congestion shows up in your KPIs.

Site prioritization

Rank candidate sites by the people inside their predicted footprint, not by area alone.

Coverage reporting

Report population coverage for license obligations and investment cases from the data your planners already use.

What you receive

An H3 grid with residents and density per cell, per-building estimates, and two allocation models to compare.

Checked against the housing registry in Noginsk: building volume ranks apartment counts with a Spearman correlation of 0.80 across 476 apartment blocks.

3D maps

Terrain, buildings and vegetation, each with its height

Every obstacle between the antenna and the subscriber, extracted by AI from one recent satellite image. No lidar flight or stereo survey to commission.

±3–4 mbuilding height RMSE in dense urban areas

≈1 min per km²of very-high-resolution imagery processed

Terrain
Terrain and surface models aligned with every other layer.
Buildings
Footprints with heights and building class.
Vegetation
Tree crowns and vegetation polygons with heights, plus a canopy height model.
Roads
The road network, for street-level clutter and drive-test routes.

From terrain to a radio plan, then kept current

  1. Talgar colored by elevation with 2 m contours, in the surrounding terrain
    1

    Load the terrain

    Start from a terrain model of the area: Copernicus GLO-30 or the elevation data you already use.

  2. Buildings and trees extruded to their heights over the land-use map
    2

    Generate the city from fresh imagery

    Mapflow classifies land use and extracts every building and tree, with its height, from recent satellite imagery.

  3. Predicted signal strength around a three-sector site on the 3D city
    3

    Plan the radio network

    Load the layers into your planning tool and predict coverage on the city as it stands today.

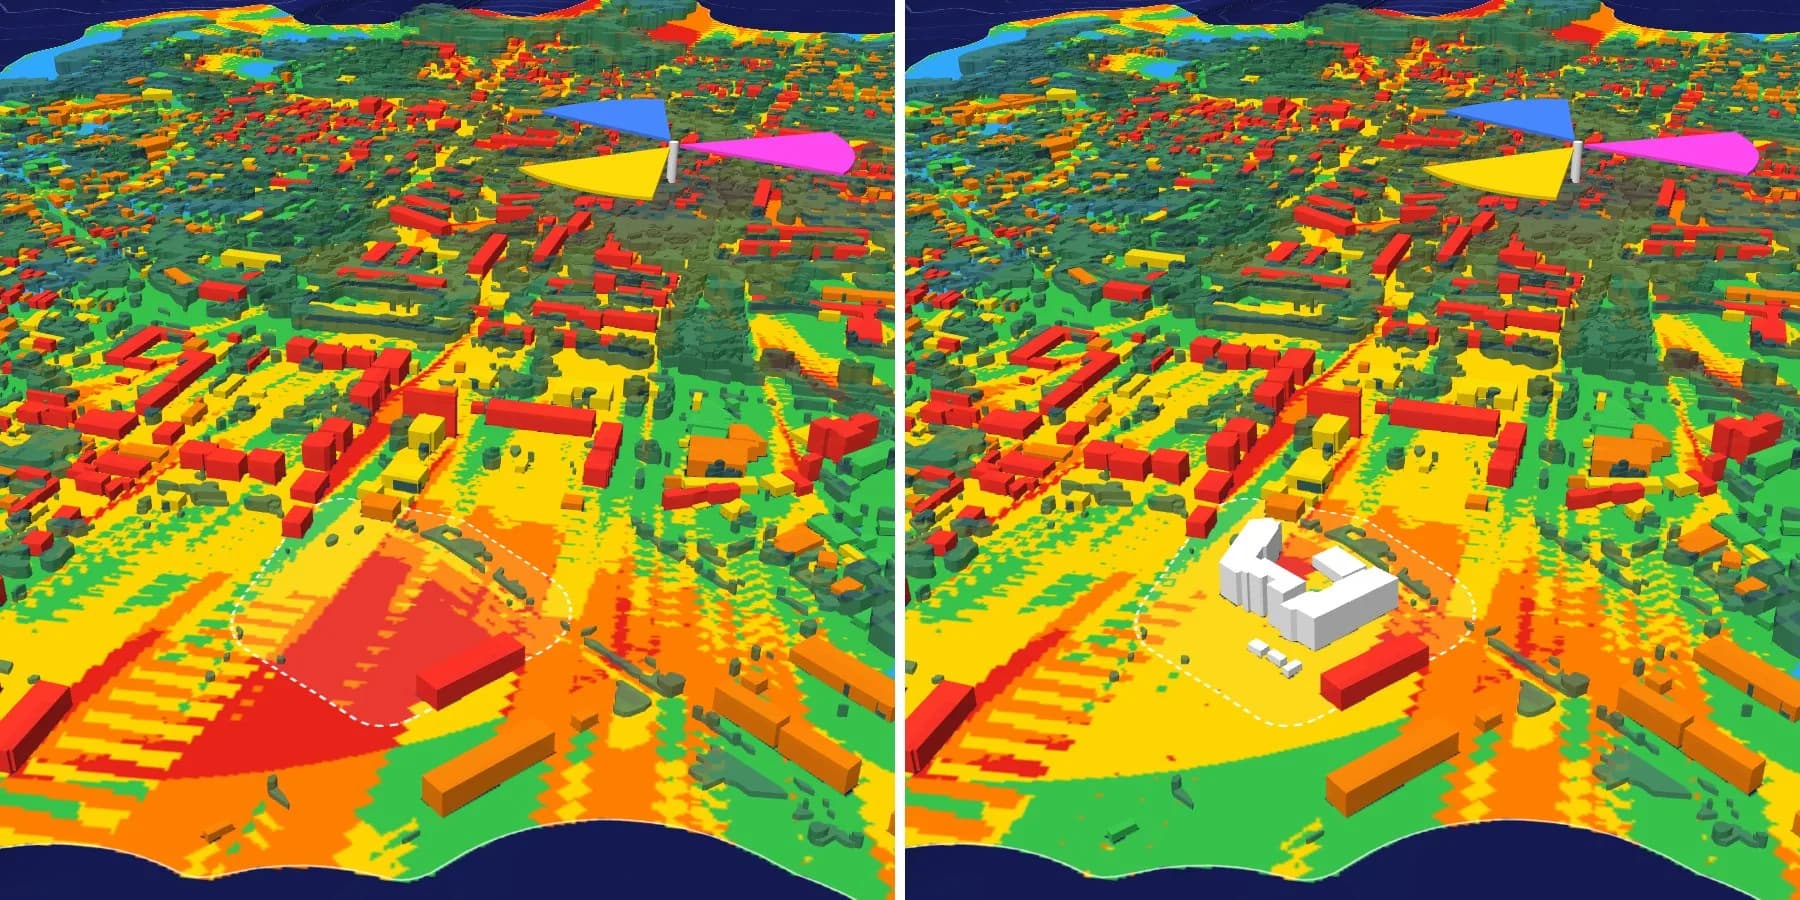
  4. Before and after: an empty construction site with strong signal, then new apartment blocks with a weaker-signal shadow behind themBeforeAfter update
    4

    Update only what changed

    When new imagery shows a change, such as this construction site, Mapflow re-maps only that area and you recalculate the network.

Talgar, Kazakhstan. The site in step 4 is marked as active construction in OpenStreetMap; its new blocks are in the latest Mapflow buildings. Terrain: Copernicus DEM GLO-30. Coverage from a simplified propagation model, for illustration.

Atoll-ready datasets

Load it into your project and run predictions the same day

We convert the 3D map into Atoll geographic data, mapped onto your clutter model and set in your project's coordinate system. Every delivery records the imagery dates and sources behind it.

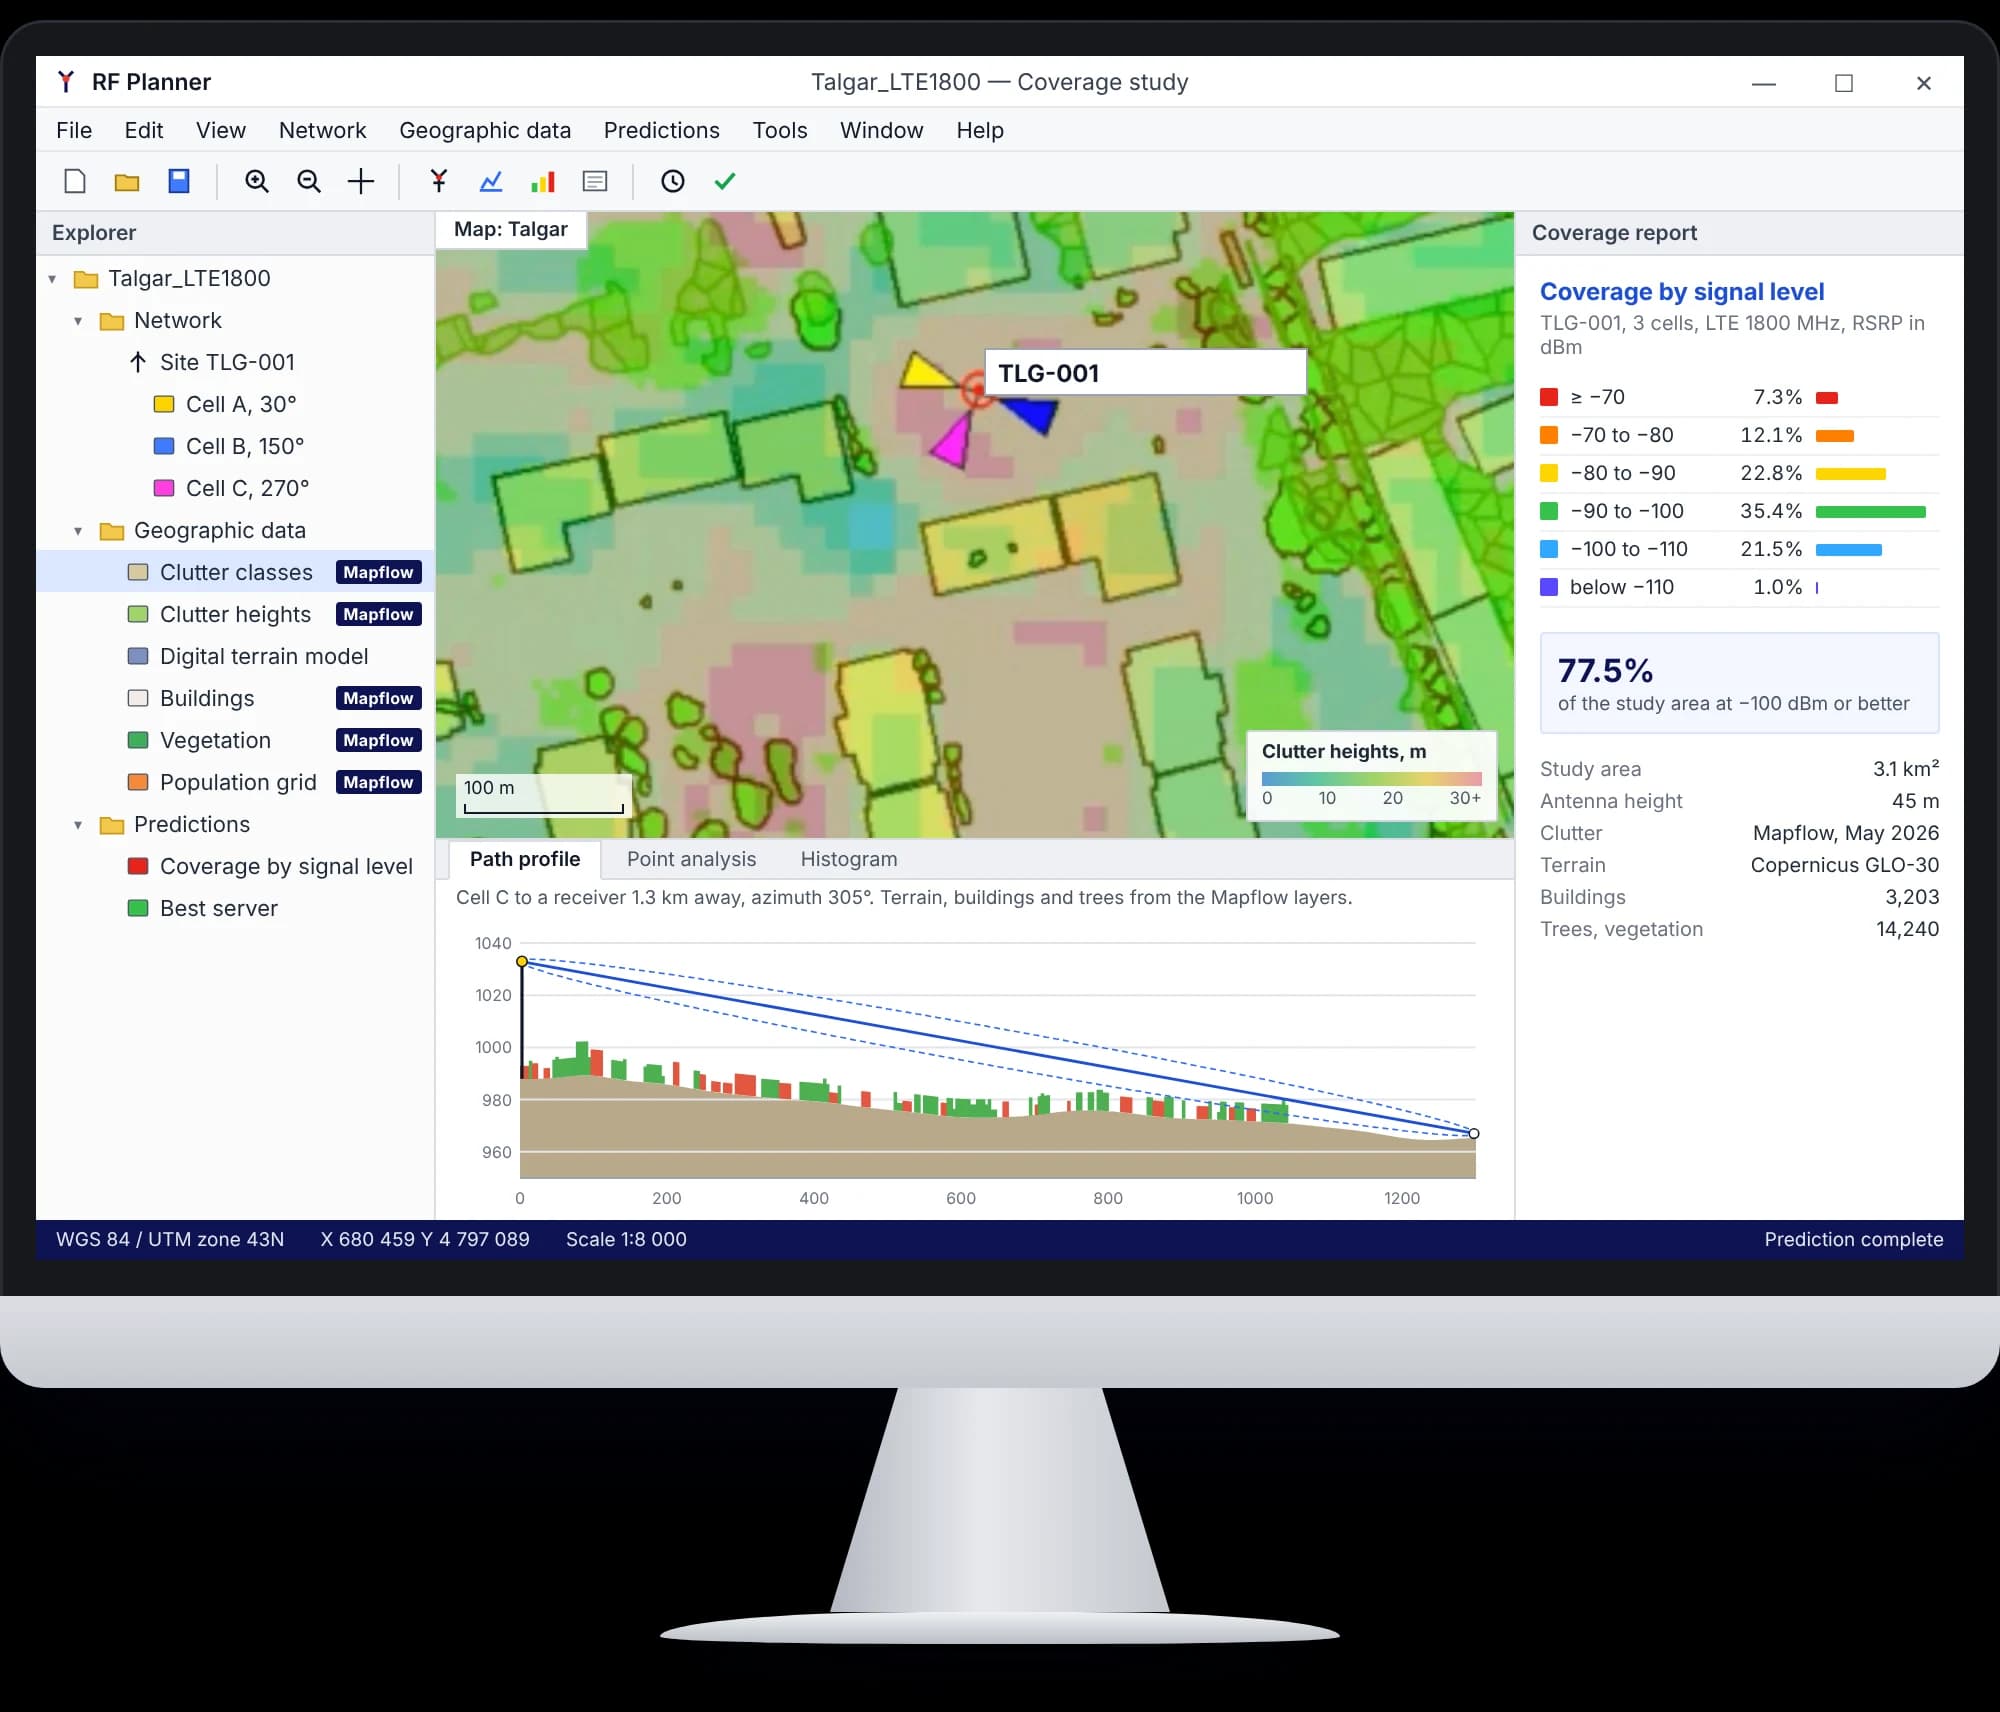
An RF planning project on a desktop monitor: Mapflow clutter, buildings, vegetation and population layers in the project tree, the site on a clutter-height map, a path profile through buildings and trees, and a coverage report
Mapflow layers loaded into an RF planning project, with a coverage study run on top of them. Illustration.

In the package

  • Clutter classesraster, mapped to your class list
  • Clutter heightsraster, from buildings and vegetation
  • Terraindigital terrain model
  • Vectorsbuildings, vegetation and roads with heights
  • Quality reportimagery dates, sources, accuracy

Raster and vector formats Atoll reads, including GeoTIFF, BIL, Shapefile, GeoPackage and GeoJSON.

Example clutter classes

  • Dense urban
  • Residential
  • Industrial and commercial
  • Forest
  • Parks in urban
  • Open area
  • Inland water

New area

A complete dataset for a city, region or rollout corridor, built from the most recent imagery available. Mapflow searches basemaps and commercial providers for the freshest scenes over your area and alerts you when new ones arrive.

How Mapflow imagery search works

Update for an existing dataset

Keep your vendor dataset and refresh only what changed: new and removed buildings, grown vegetation and new roads, merged into your clutter. Days instead of a new purchase every one to three years.

  1. 1Fresh imagery for your area
  2. 23D extraction of buildings, vegetation and roads
  3. 3Changes found against your current map
  4. 4Changes converted to your clutter classes and heights
  5. 5Updated layers merged and delivered
Talgar in 3D: buildings and trees at their heights on the land-use map

Case study

Talgar, Kazakhstan: updating an Atoll dataset without buying a new one

We compared an existing Atoll dataset for 40 km² around Talgar with layers Mapflow extracted from recent satellite imagery, then converted the differences into Atoll-ready updates.

9,982

buildings missing from the existing dataset

97%

of them houses 3–10 m tall

12.7 km²

of vegetation mapped with heights, nearly a third of the area

Read the case study on our blog

Delivered the way your team works

Files for Atoll and your GIS

A package per area, in your coordinate system and clutter model.

Mapflow web and QGIS

Review layers, run new areas and download results yourself.

API

Automate scheduled updates for the districts that keep growing.

Secure cloud or on-premises

On-premises deployment when your data can't leave your network.

Send us an area you plan for

Tell us the area and the datasets you need. We'll process a sample and show you the population grid, the 3D map and what changed against your current clutter.

Send us a message